Ekinomics: UK and Japan house prices, station by station
/ 10 min read
Table of Contents
For about 10 years now, I’ve been keeping a Google Photos album of scans of SUUMO’s 価格マップ - price maps from one of Japan’s big property listings brands. That album eventually became Ekinomics, a station-by-station map of house prices across Japan and Britain.
I always liked those visuals. Less for any particular data point than for what their presentation says about the markets they serve: the property market is hungry for granular information about pricing trends. And in Japanese cities, the way people consider property leads naturally to a price map broken down by station, laid out like a transit map. Or rather, on a transit map. (I’ve always been a transit map geek, so there’s also that.)

It’s mainly down to how Japanese cities work. In most of the big ones, getting to work means getting on a train, and the commute - and transport convenience more generally - is a major consideration for anyone buying. So it makes sense to track prices station by station, rather than by city or even by ward (a city district). The station is the unit people are actually choosing. It may also be that Japanese consumers like this kind of data presentation.

This post is about how that album turned into Ekinomics, which maps property prices in major cities, station by station, across Japan and Britain.
From scans to data
For years I’d fancied turning the SUUMO scans into something structured - a searchable database of price trends over time, so I could see which areas were gaining in value and which weren’t.
The catch was what the maps were about. The data leaned towards new-build flats, and that’s no accident. SUUMO is a Recruit media property, supported by real estate development companies - part of the new-build industrial complex, if you will. I don’t mean that as a criticism - to explain why a thing is the way it is, it’s natural to follow the money. But it made the maps useful primarily for those in the market for a new-build flat, and much less so if you weren’t.

And the question I cared about - which geographies are becoming more and less desirable - isn’t only a new-build question. It’s about the whole market, including houses and flats, both new and second-hand.
Still, I started where the album pointed: working out how to digitise the scans and give the numbers some structure.
Then I found out that the data I’d need to do a better job was already available, at MLIT (the Ministry of Land, Infrastructure, Transport and Tourism). Its Real Estate Information Library publishes transaction prices from its own survey of buyers - apartments, houses and land, quarter by quarter, back to 2005. Every record names the nearest station, which is the unit I was after.
I’d also been enjoying vibe coding, and was itching for another project. So over a weekend I built it.
Bringing it to Britain
Once I’d done Japan’s big three conurbations (Greater Tokyo, Osaka and Nagoya), I considered London, my city of birth.
It turns out the UK publishes something similar. HM Land Registry records the price of every home sold in England and Wales back to 1995 (its Price Paid Data), and Britain has transit-centric markets of its own - London and its commuter belt most obviously, Newcastle’s metro, though many other markets too (some of which are served by trams). So it seemed worth repeating the exercise there, and looking at house prices near train stations the Japanese way.
It wasn’t a straight copy. The Land Registry records what the buyer paid but not the property’s area, so there’s no price per square metre to be had from that source. The missing piece came from researchers at UCL, who matched those sales to energy performance certificates, which do record floor area. Scotland and Northern Ireland needed sources of their own. Registers of Scotland and Northern Ireland’s Land & Property Services publish sales by small area rather than one by one, and without floor areas, so the Scottish and Belfast maps show price per home instead.
Then there’s the organising unit itself: the station.
Japan’s property market tends to think in stations. Britain’s tends to think in postcodes. But postcodes can be mapped to stations - each sale goes to the nearest one within 1.2 km - and that gives you a Japanese-style house price map of the UK, which I hadn’t seen done before. Whether British buyers actually choose that way is a fair question. But it does put the two countries side by side on the same terms, and with the help of AI it doesn’t take much time or effort to create.
What’s on the site
The result is Ekinomics (駅, eki, means station). As of 28th October 2026 it covers 47 cities on 29 maps: 25 in Japan, from Sapporo to Naha, and 22 in the UK, from Bournemouth to Aberdeen and over the pond to Belfast. That’s about 4.5 million Japanese transaction records and 5.7 million in the UK, across some 9,900 stations. Greater Tokyo alone is just under 1.9 million transactions across 1,966 stations. The homepage maps every city’s price change since 2014-15, so it’s a good place to start.
Each station shows its median price per square metre (per home on the Scottish and Belfast maps) in two-year windows from 2006-07. (They’re medians, not a price index - more on that at the end.) You can slide through time and watch the map change colour, switch to Change to see how far each station has moved since a year you pick, and switch between property types (apartments, houses, land etc). It works in English and Japanese.
A few things to look for
The links below open each map at the view described. If you’d rather not go hunting, every page has a “Biggest risers since 2014-15” preset.
The UK
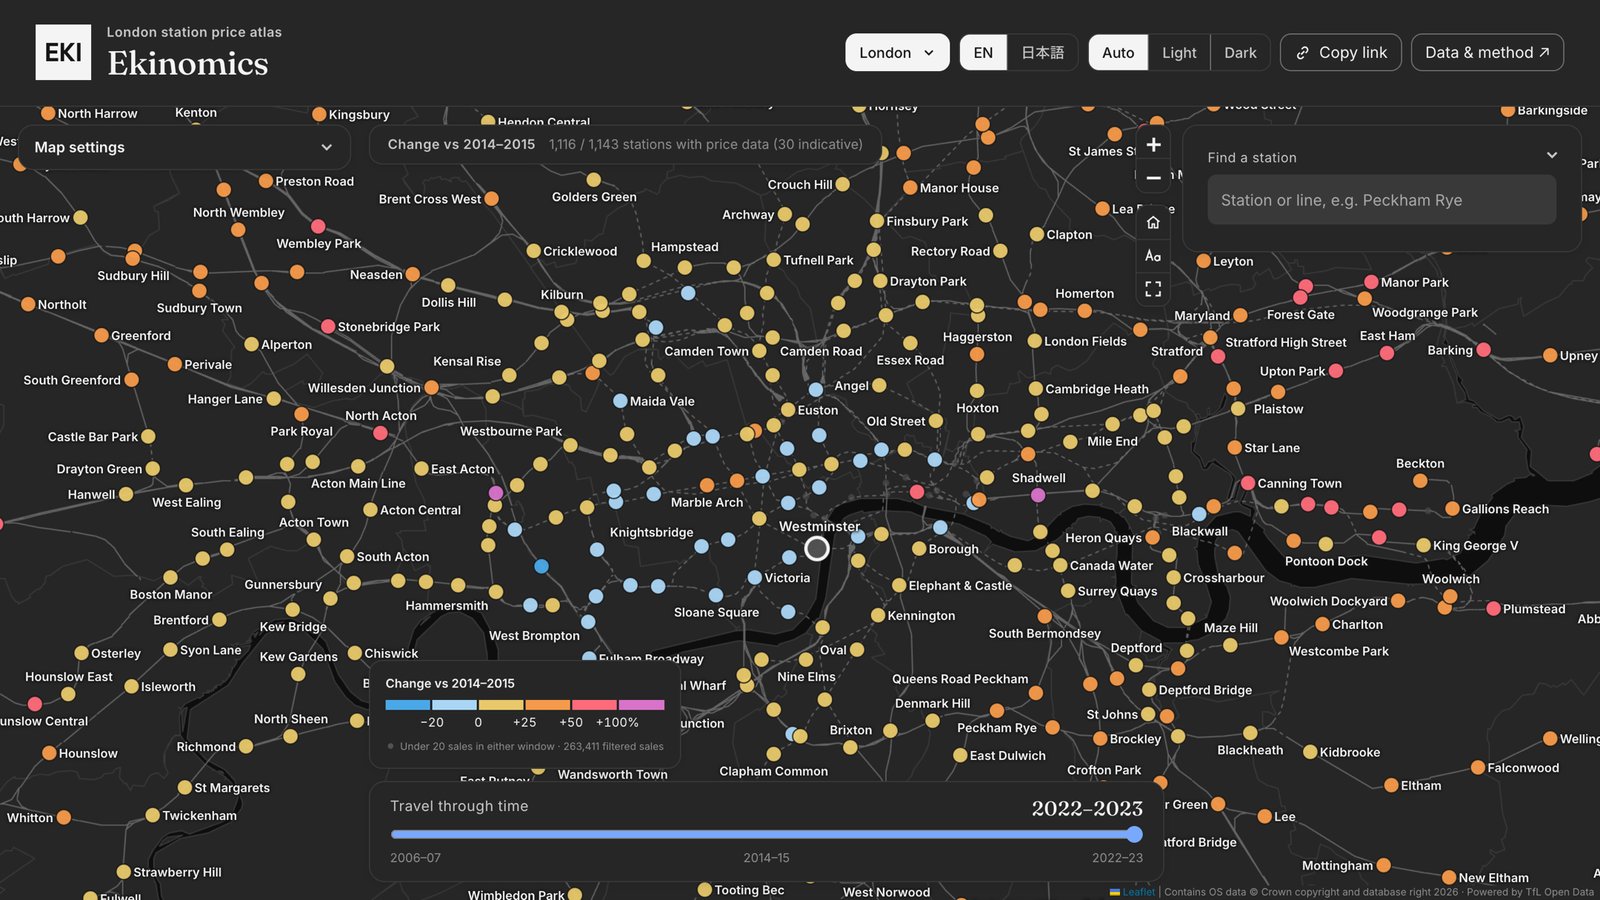 Prime central London went backwards. On the London map’s Change view, Knightsbridge, Oxford Circus and Waterloo were all down 15 to 17% between 2014-15 and 2022-23, and Kensington (Olympia) about a quarter. Over the same stretch Margate nearly doubled and St Leonards (Warrior Square) rose more than 80%. The central big cities belt beats the capital too: the typical station is up about 52% on the North West, Birmingham and Bristol pages, against 34% on the London page, commuter belt included.
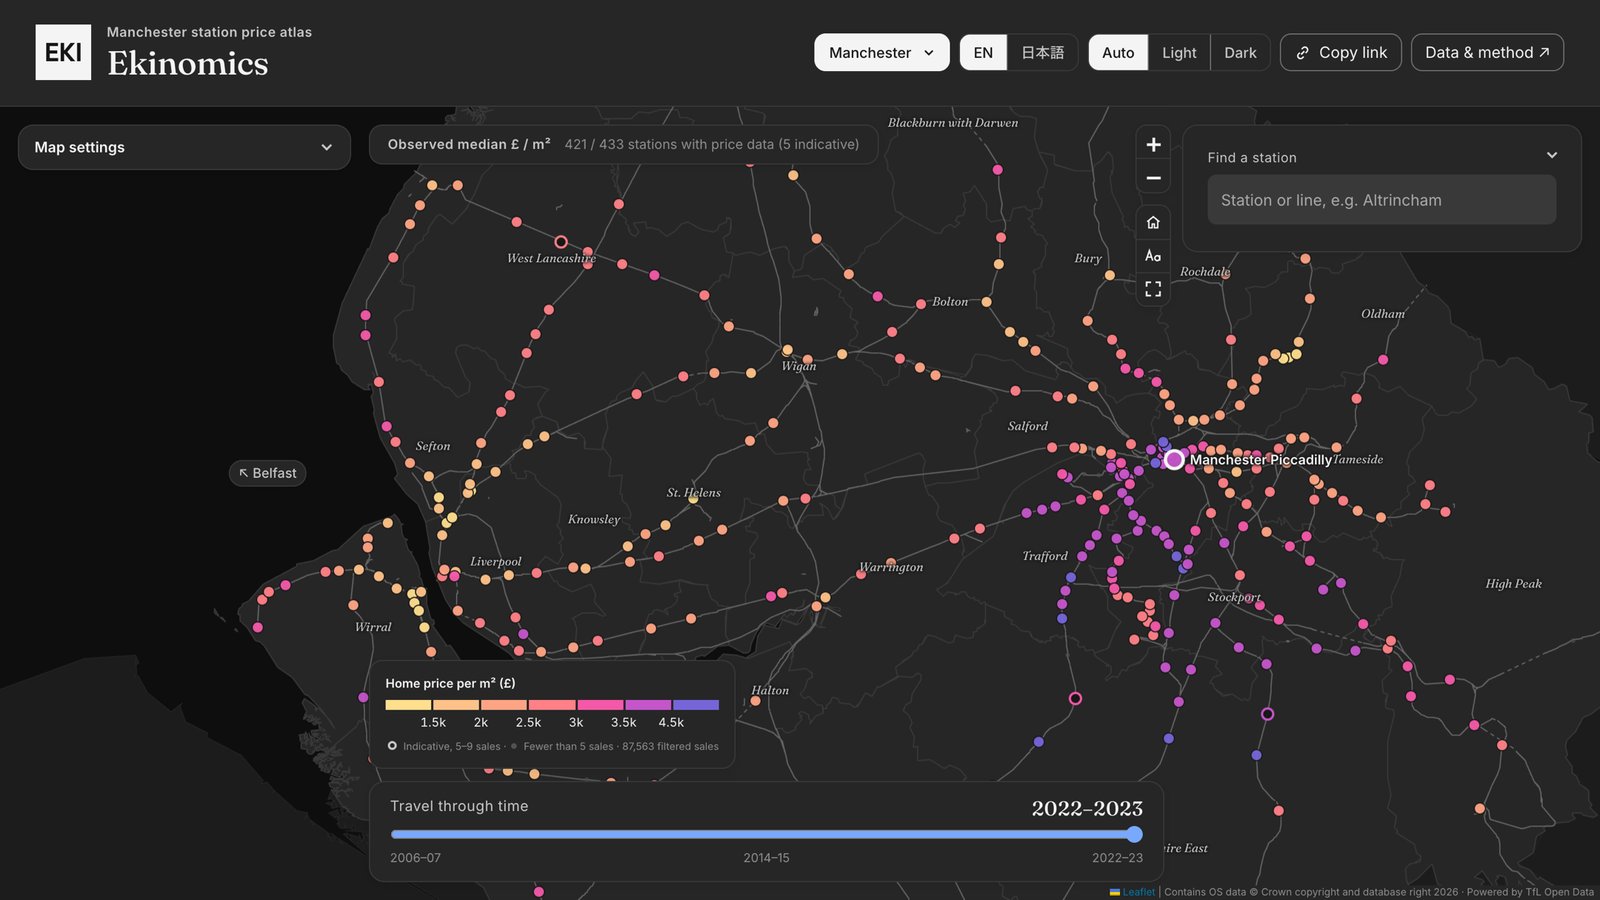 Liverpool and Manchester have opposite shapes. Pick Liverpool or Manchester from the menu - they share a map - and compare the two. Liverpool gets more expensive the further out you go (after a dip just outside the centre). Manchester is the other way round: its core is the dearest part on average.
| Typical station, 2022-23, per m² | Liverpool (from Lime Street) | Manchester (from Piccadilly) |
|---|---|---|
| Within 3 km | £2,200 | £3,600 |
| 3 to 8 km | £1,750 | £3,100 |
| 8 to 15 km | £2,500 | £2,750 |
| 15 to 25 km | £2,650 | £2,850 |
The dearest stations on Liverpool’s side are out on the Wirral and up the coast - Heswall, West Kirby, Freshfield. Manchester’s very top end is in the southern suburbs - Hale, Didsbury Village, Timperley, Alderley Edge - but the centre holds its value in a way Liverpool’s doesn’t. Twin cities, at either end of the world’s first inter-city railway (thanks Stephenson!), each the inverse of the other.
Japan
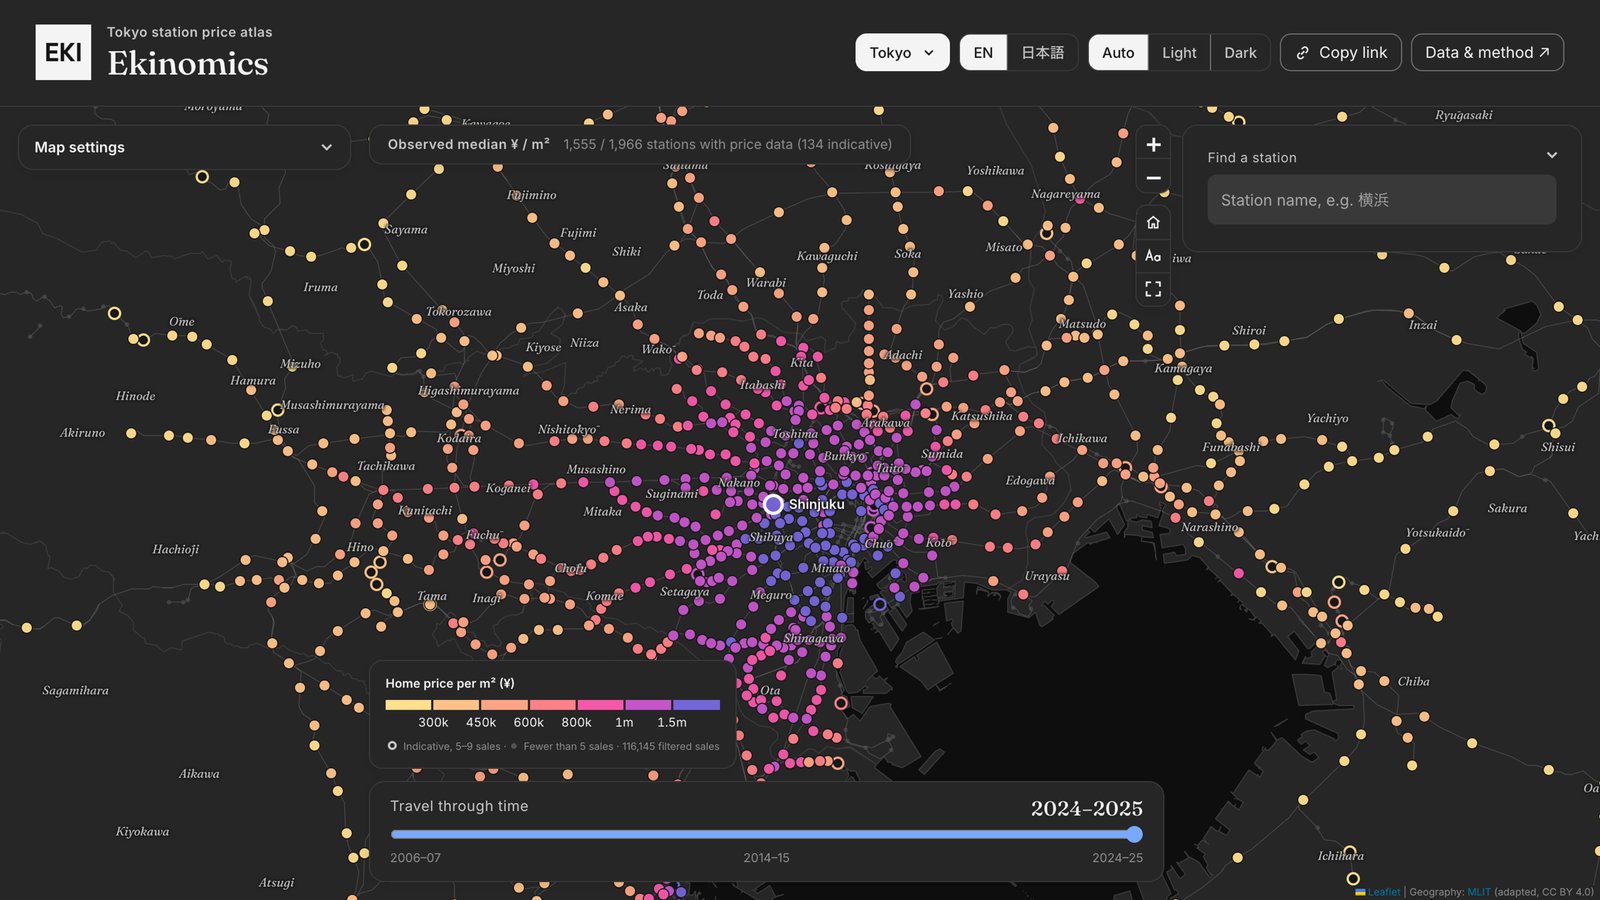 Greater Tokyo is a bullseye. Tokyo property prices have risen fastest closest to the centre. Switch to Change against 2014-15. The typical station within 5 km of Tokyo Station is up about 70% by 2024-25; 5 to 15 km out, about 58%; 15 to 30 km out, about 37%; 30 to 60 km out, about 20%. Beyond 60 km, prices have slipped. Three of the six biggest risers - Roppongi-itchōme, Kamiyachō and Hanzōmon - are right in central Tokyo. That fits the commuting point: the typical buyer here is paying for convenience.
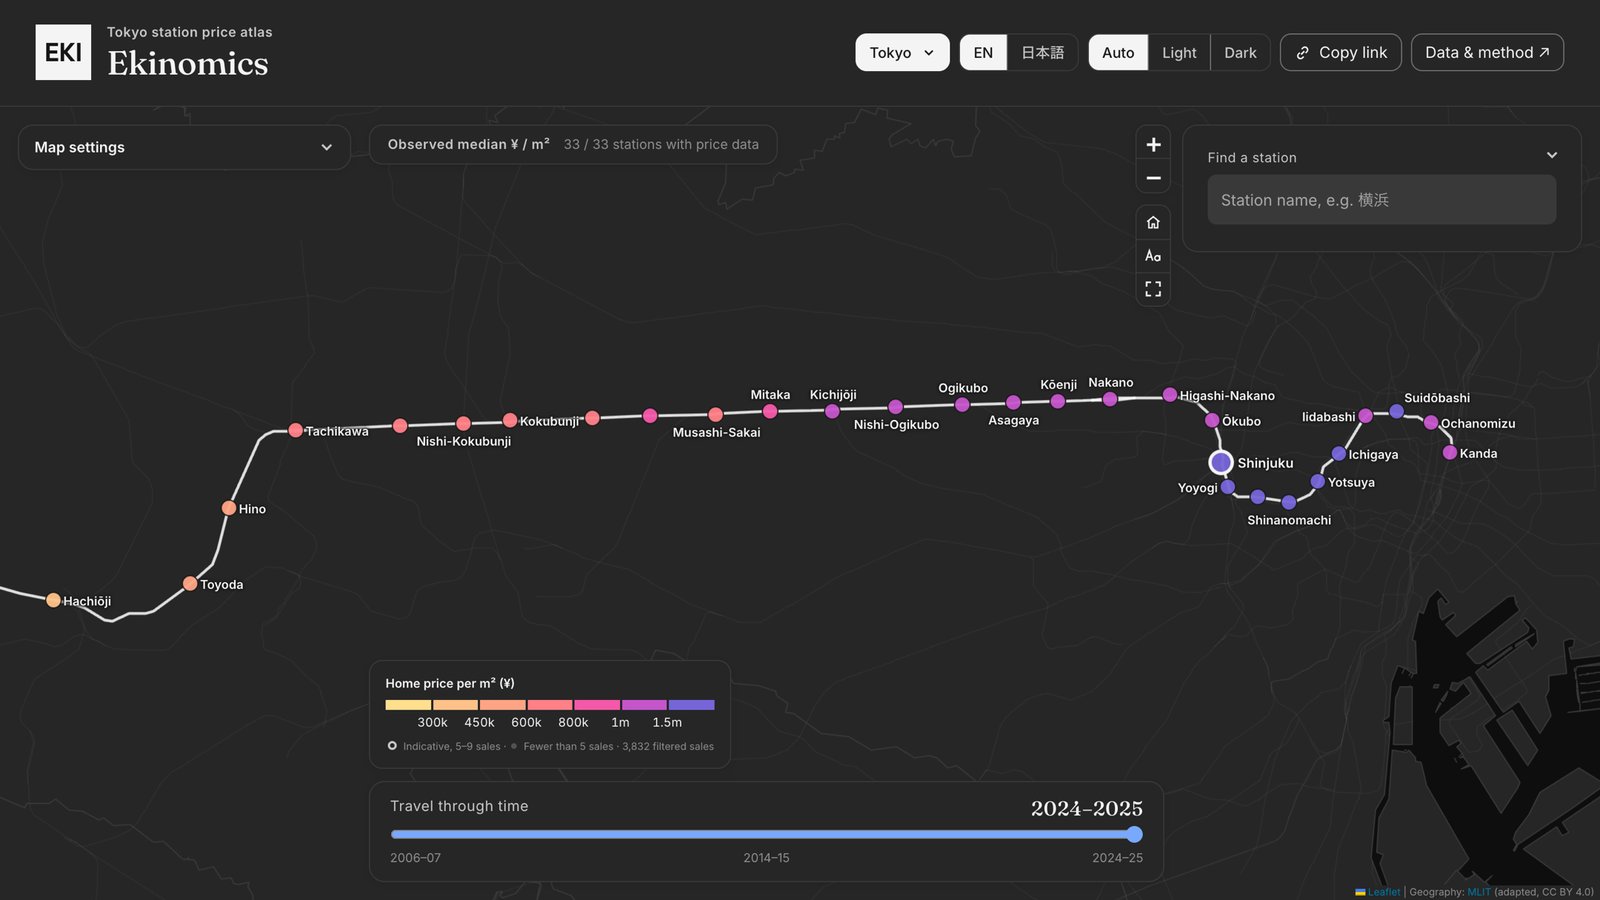 Follow the Chūō Line west. The bullseye isn’t round. Pick the Chūō Line from the Railway menu on the Tokyo map and watch what happens west of Shinjuku: prices barely drop for the first 17 km. Homes around Nakano sold at a median of about ¥1.13 million per square metre in 2024-25. Around Kichijōji, outside the 23 wards altogether, it was about ¥1.03 million - close to the typical station inside them (about ¥1.09 million). The typical station 17 km from Tokyo Station on any line is about ¥610,000. Tachikawa, 32 km out, still sells at more than double the typical station at its distance.
Across the stretch from 10 to 35 km out, here’s how some of the lines compare with the typical station at the same distance:
| Line | Against the typical station |
|---|---|
| Chūō | about 46% above |
| Tōyoko, Den-en-toshi | about 30% above |
| Keiō | about 17% above |
| Seibu lines | about level |
| Tōjō, Sōbu (east of the city), Jōban | below |
In other words, the brand advantage of the JR Chuo line, as well as well-regarded private lines like Keio and Tokyu, are clearly represented in these data. By Hachiōji it’s gone on the Chūō Line too. #hachiojierasure
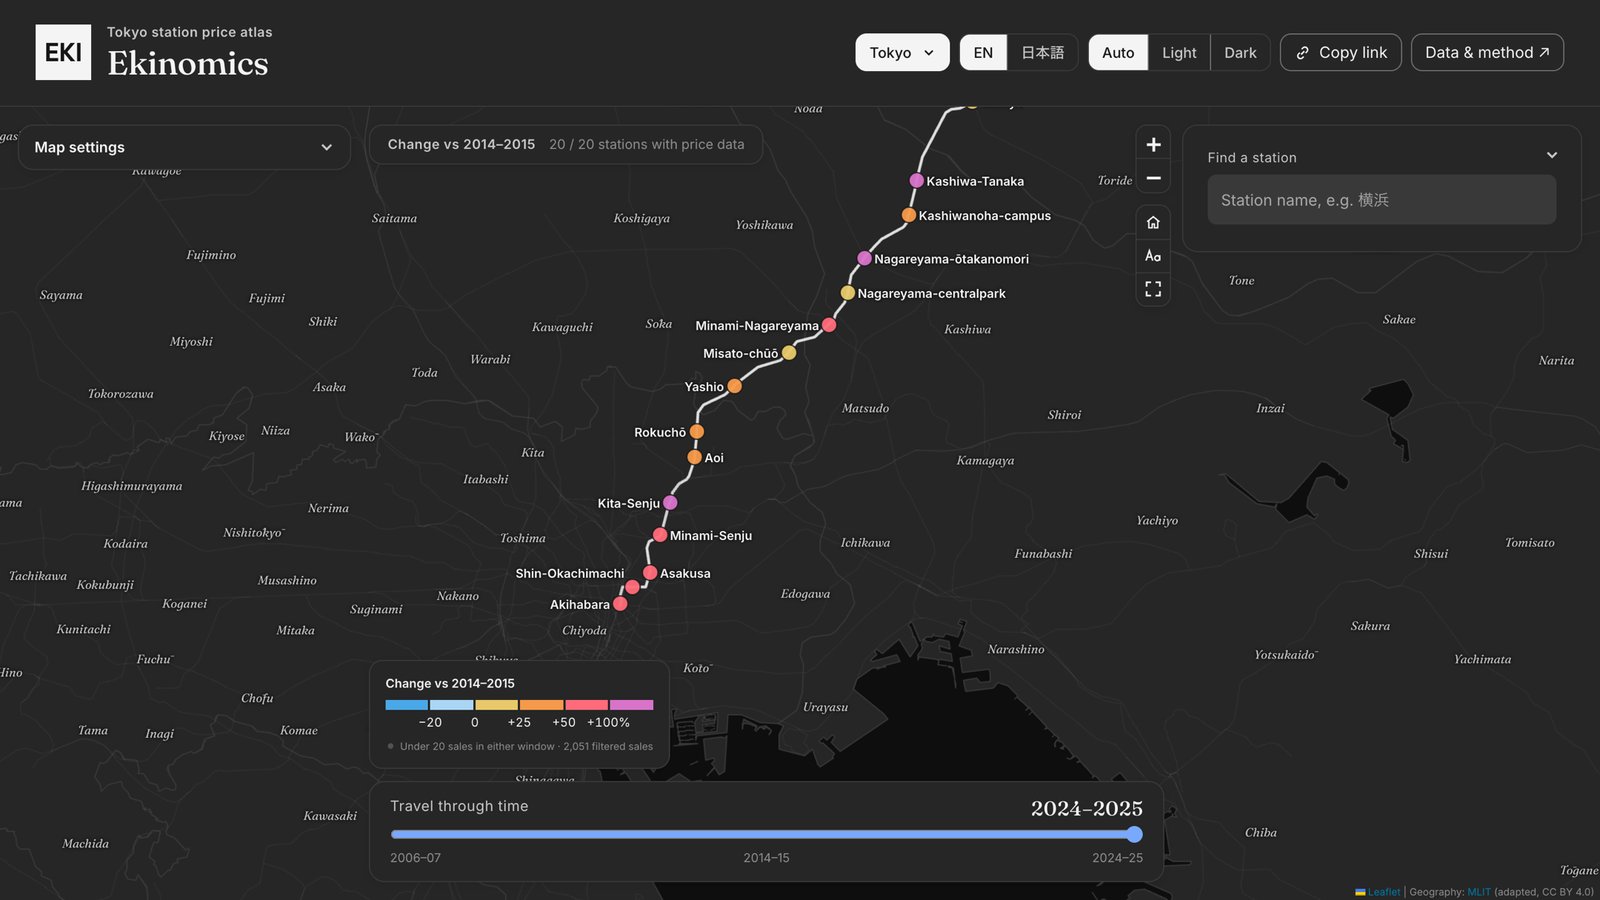 The Tsukuba Express growth story. It only opened in 2005, running north-east out of Akihabara. Pick it and switch to Change against 2014-15, and its typical station is up about 49%, against 36% for Greater Tokyo as a whole. Nagareyama-ōtakanomori has more than doubled.
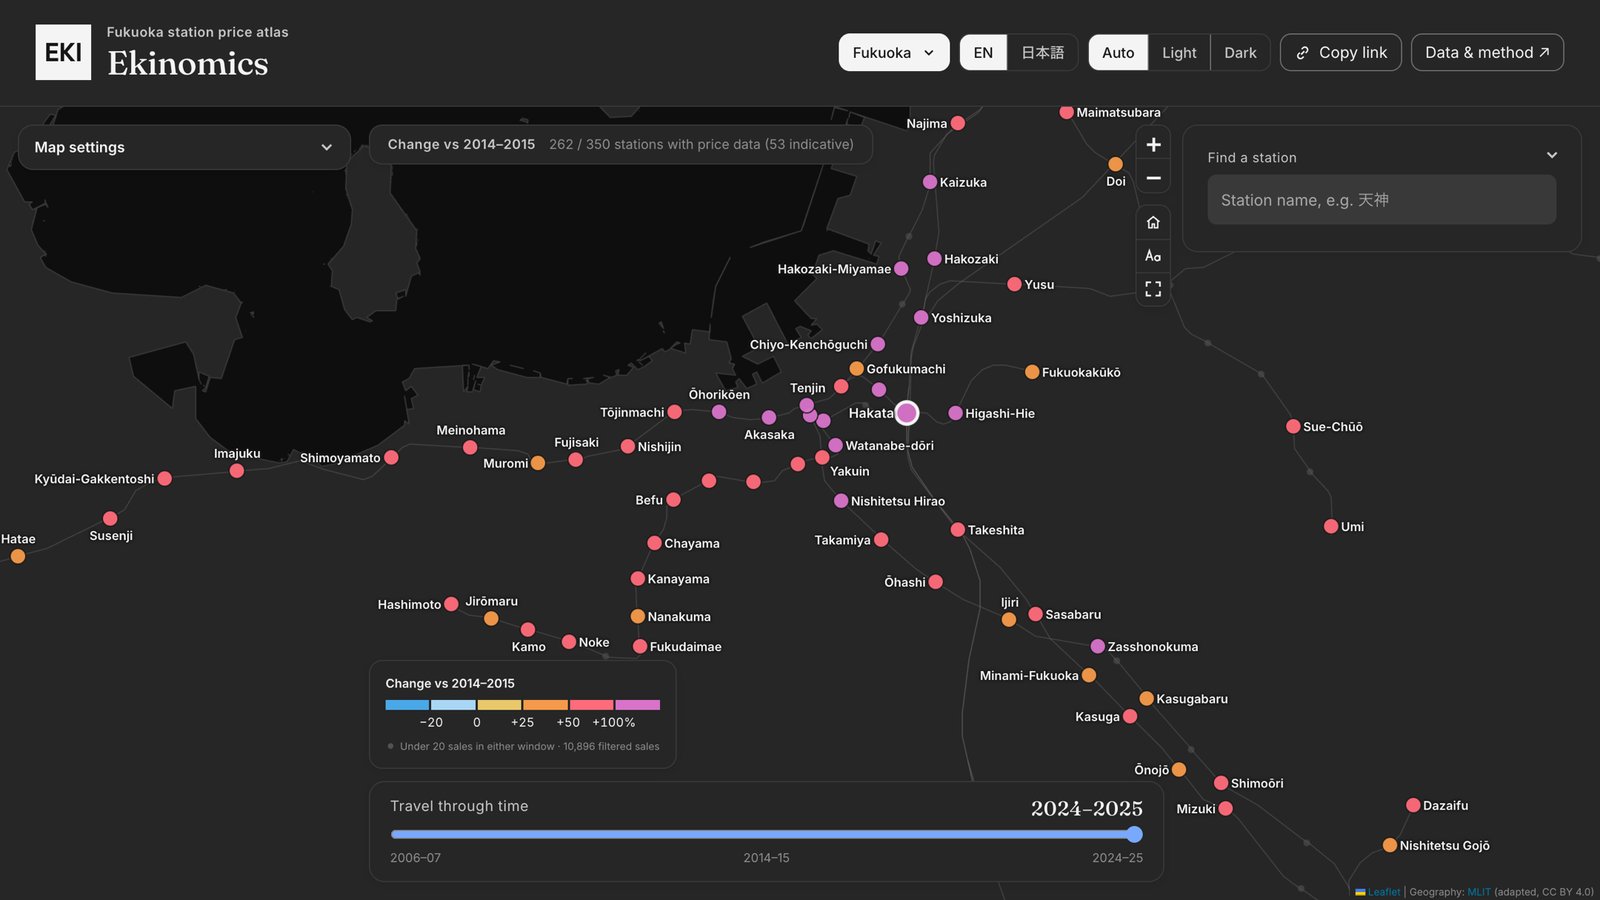 Fukuoka has outpaced Tokyo. Its typical station is up about 51% since 2014-15, against 36% for Greater Tokyo and under 20% for Osaka and Nagoya. Tenjin and Gion, right in the middle of the city, are among its biggest risers. All I ever seem to hear about Fukuoka is rave reviews of the food and startup scenes, so this fits the vibe.
A word on the numbers
They’re medians, not a proper price index, and they’re not adjusted for inflation. If a station’s sales tilt towards bigger or newer homes in a given window, its median moves without any one home being worth more. So the site shows how many sales sit behind each number, and the mix of sizes and ages, and holds back comparisons where there are too few sales to be significant. The UK data also stop at 2023 for now, because the floor-area link does (the Scottish and Belfast maps keep to the same windows). The Japanese data run to 2025.
For Japanese readers, I figured, this should be ready-made catnip for the real estate geek, the transit geek, or both. I’ll be interested to see whether more of the traction comes from British or Japanese visitors.
It’s all at ekinomics.com. Check the maps against your intuitions, and let me know if you enjoy it! I’m on Twitter and Instagram.